Let the kids cycle

Abstract: Improving levels of walking and cycling is critically important for the nation’s health and wealth.  This article explores the reasons why focusing on working with children and schools to enable cycling in particular is likely to yield the best results for mode shift, by looking at behaviour change models as well as  what is known about human travel behaviour.


Background:

It is critically important that we allow more people to choose to travel by walking and cycling.  This is for a number of reasons:

More walking and cycling tackles all of these issues at once. Walking and cycling are also, fairly uniquely, in both the individual’s interest to participate in (saving money, faster travel, better health) and in the Government’s interest for individuals to participate in (reduced expenditure, improved population health, greater productivity from the population).


Why focus on cycling?

Looking at the walking environment in the UK, it is clear that walking is an accessible option for many, at least for short journeys – although there are problems caused by the volumes of motor traffic (i.e. crossing times, noise and pollution making for an unpleasant walking environment).  Cycling, on the other hand, provides a viable option for many more journeys by allowing for greater distances to be covered; shorter journey times and larger carrying capacity.

But cycling is not currently viewed as a viable mode of transport by many; mainly due to fear of motor traffic associated with lack of fit-for-purpose provision for cycling. It is my view that in general, the things which facilitate cycling also help to reduce motor traffic volumes, therefore improving the walkability of an area in the long run. The same argument applies to good public transport – however, this is provided at much greater expense to the state.  We should therefore be prioritising cycling as the area for greatest potential gains.

It is clear that one of the features that stands out about cycling cultures is that there is a great emphasis on allowing and encouraging children to cycle. In the Netherlands, the Fietserbond (Cyclists’ Union) go into schools to deliver cycle skills training, and new schools are designed in such a way that they are away from roads; encouraging walking and cycling.  The Danish Cycling Embassy are keen to focus on the importance of encouraging children to cycle.    


Overcome the barriers to entry early

Beyond the immediate environment, there are a number of skill and knowledge based barriers to cycling.  Potential utility bike riders need to know: how to ride a bike; where to go to get bike repairs; where to go to buy a bike; what sort of bike is likely to be practical for them; how to plan routes to where they want to go; how to manage traffic whilst riding (even in the Netherlands, cyclists must mix with low levels of low speed traffic on occasion); how to carry a passenger; how to secure a bike so that it won’t get stolen.

Helping children overcome these barriers means that not only are they more likely to be able to cycle as children – but they will turn into adults with cycling as a practical choice, without these barriers to overcome.


Humans are habit-forming creatures

The reason why there is sometimes a gap between what seems rational in terms of behaviour and what we actually do, is habit. It seems likely to me that as decision making is hard, and uses limited resources, humans tend to use strategies to minimise the need for this.

Habit or routine is one such strategy. Rather than re-think every single decision every single day, we take a decision once, and then just re-use that decision. I think this is why we find starting a new job, a new school, or even using a new mode of transport so exhausting – because we’re having to make many ‘new decisions’.

Some people take habit to extremes – for example, Mark Zuckerberg buys multiples of the same clothes, and generally wears the same outfit every day to minimise energy spent on ‘frivolous’ decisions.  I’m not sure this is rational for everyone however, as appearances do count for most of us, most of the time – this might be especially true if you’re from a poorer background.

If we are minimising new choices, then it is logical to think that we will use modes of transport that we are most familiar with. This is borne out by what we see in travel choices of individuals, with previous travel behaviours often carried forward when circumstances change. For example, immigrants living in the Netherlands are more likely to cycle than people in their home country, but still significantly less likely to cycle than those born in the Netherlands.

My personal experience bears this out (anecdote alert!) – on moving from the country where driving had quite a lot going for it, to London where it didn’t, I continued driving for most journeys until a budgetary crisis forced a rethink and ‘eureka’ moment of realising that cycling was, for me as someone who had learned to cycle on the road as a child, much faster and much more efficient than driving  as well as saving me a shed-load of cash and allowing him to go on holidays again (even if recently these ‘holidays’ mostly ended up turning into field trips exploring and trying to understand what has underpinned development of cycling cultures in places such as the Netherlands, Denmark, parts of Switzerland, parts of the US etc…).

Making sure that children have a habit of cycling for at least some of their journeys, then, is likely to lead a higher adult cycling population.  It should be noted I am saying ‘this is likely’ because it is surprisingly difficult to find direct, thorough research on this effect – please do comment below if you manage to find any!


Parents and carers are likely to be more open to changing travel behaviour than other adults

Working with children doesn’t just benefit the children themselves. Children have parents, and often a network of carers (family and friends) who also have an incentive to want to join in with cycling that the children may be doing – if the child is enjoying something, they want to be part of that.  Not only this, but behaviour change models suggest that we tend to be most open to changing our behaviour when we change something in our routines. Children are constantly changing routines, and causing change in their carer’s routines too – changing schools, a new after-school club, all these result in carers having to re-think their travel routines.  These continual transition states provide a great opportunity to get the carers involved in cycling too.


Best practise design for allowing kids to cycle is best practise for everyone

Children have smaller legs than adults and therefore have the greatest need for direct routes that minimise gradients and stopping; they also have the greatest need for both subjective and objective safety, with forgiving design allowing for mistakes.  These attributes are also the attributes that make for the most attractive cycling routes for adults too – faster routes that feel, and are, safe.


Summary

Working to enable more children to cycle not only has huge benefits for children directly empowered to cycle, but also has a disproportionate benefit in terms of enabling more travel by bike in general. The children directly empowered are likely to choose cycling as a mode choice throughout their life (ie 60-70 years of benefit from the behaviour change effort), but they are also likely to encourage parents and carers, who are more likely than other adults to reconsider their travel options and therefore take up cycling.


Conflict of interest statement: I work in local authorities on a range of projects which are all at least partly aimed at allowing children to use bikes for useful journeys.


2 Comments

Filed under Uncategorized

What’s the impact on total CO2 emissions of electric cars or – are they really fossil fuelled?

The recent Volkswagen Diesel scandal has resulted in renewed debate around electric vehicles (EVs) and encouraged me to give some more thought to my feelings on them.

As usual I am interested in their use from a benefits to society/transport planning perspective rather than an individual consumer perspective – it may make perfect sense for individuals to get an EV depending on their circumstances.  However, while I consider that they may be a fix to significantly reduce air pollution in cities (although at least one, extremely thorough, study suggests that this is not clear cut, with some places in the US getting a disbenefit from electric car use in terms of air pollution) – they leave the host of other problems that come with motor vehicles including road danger, noise (most noise from motor vehicles being associated with tyres or the vehicle moving through the air, rather than engine noise), the road space requirements for them splitting communities and fail to deliver the exercise benefits of active travel – or public transport which frequently involves at least some active travel in every journey.  In addition to this, a large chunk of the particulates associated with motor vehicle usage actually come from wear and tear on tyres/brakes – these particulate emissions will remain whatever method propels the vehicle.

I am specifically interested in whether EVs will reduce carbon footprints over conventional vehicles.  If a government is worried about climate change, does it make sense to invest time, money and effort into promoting their use?

Other Analysis:

A quick dive into the available literature brings up a few different sets of analysis.  It seems that how effective they are at reducing (or not) CO2 emissions relative to conventionally powered motor vehicles is highly sensitive to the source of the electricity powering the EV.  What is interesting about all of the analysis I found is that it all assumes that adding an extra load on the electricity grid does not change the mix of electrical supply.  i.e. an increase in demand from electric cars increases the amount of renewable energy or efficiency of electricity production – on which more later.

Here’s a particularly clear graph which popped up, from this article here:

Screen Shot 2015-09-30 at 22.12.22

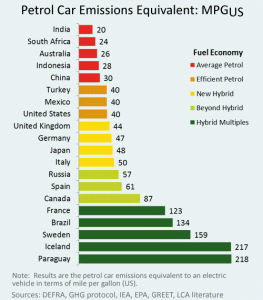
They also put together a neat little graph, re-scaling this into MPG equivalent which seems more intuitive to me.  On this scale, a petrol car which can achieve better than 30mpg is a better choice for reducing CO2 emissions than an electric car from a coal-heavy electricity mix.  The best modern petrol cars, when driven in an efficient manner, can deliver double this!

Emissions-Equivalent-Petrol-Car

According to this type of analysis, in the countries with the highest proportion of their electricity from renewables, it appears that an EV will beat a petrol car several times over.  In the UK, an efficient petrol or diesel car will just about beat an EV.  However, I think there are problems with using this type of analysis as it is based on a key assumption which I think is incorrect.

A Challenge to Previous Available Analysis

This analysis, and all the rest of the analysis that I could find in the time available to me for research are all based on the assumption that drawing more electricity from the grid does not change the supply mix.  When we look at the total supply of energy for the UK provided by the National Grid, it comes to a total of about 27.3 million tons of oil equivalents.  This compares with total demand for energy by the UK road network of 40 million tons of oil equivalent.  If we assume that most fuel is burnt on longer journeys which are not practical for EVs; and that we can only realistically aim for 1/8th of this energy usage being converted to electric vehicles, the additional demand on the grid is some 5 million tons of oil equivalent.

I do not know for certain, but it seems highly unlikely to me that adding this amount of energy demand on the national grid will have no effect on the energy mix.  Although there are complications around usage of pumped hydro to store electrical energy, and efficiency of power stations under sub-maximal loads, what seems most likely to me overall is that renewable sources (with 0 fuel cost, but high installation costs) get used first, and then fossil fuels are used to top this up (because the majority of the cost of these is in the consumption of the fuel, rather than in the construction of the facility).  This seems to be supported by the fact that it is reported that the electricity mix at night, when consumption is lower, has a higher proportion from renewable sources.

If this is the case, then any extra load on the grid over and above the current usage, will result in more fossil fuels being used.  Does it not seem reasonable to assume, therefore, that the extra electrical energy needed to fuel EV’s will come from fossil fuels?

If this is the case then extra EVs adding extra load on the national grid can be thought of as being fossil fuelled, resulting in them being far less efficient in terms of CO2 emissions than more efficient petrol or diesel cars once transmission and generation losses are accounted for.

Conclusion

  1. If we look back at the data above, it seems clear that *if my assumptions are correct*, that EVs produce many times more CO2 equivalent emissions than an efficient petrol vehicle, undermining the case for subsidising and promoting the use of these vehicles.
  2. It seems that until we have a surplus of renewable energy that this will remain the case.  A government interested in reducing the country’s carbon footprint should prioritise de-carbonising the grid over the use of electrical cars
  3. Although not the focus of this article, this argument has implications for individuals who may be interested in buying an electric car to try and reduce their carbon footprint (hint: you may be better off investing elsewhere – e.g. in solar panels or a wind turbine for your house)

Does anyone have any expertise on how the national grid works that might challenge or support the assumptions that I have made above?  Please do comment if so.

3 Comments

Filed under Uncategorized

Road safety versus saving lives

I know you’re all thinking it – how can there be conflict between road safety and saving lives?

Much of the dialogue about cycling infrastructure refers to safety.  I argue here that the problem is overwhelmingly not safety as such, but that the problem is that people are not cycling and the priority of cycle infrastructure should be to tackle this first and foremost.  Sometimes this does not mean picking the ‘safest’ designs if it brings about undue delay that deters cycling.  The same applies to walking.  However, it should be pointed out that the perception of a lack of safety is the main reason that people do not cycle and tackling this is key – it should be clear that, as the Cycle Embassy of Great Britain point out, fear and genuine danger do not always go together, as illustrated by roller coasters.

Transport related deaths in the UK in a typical year:

Cycling – 118 (2012)

Walking – 420 (2012)

All road deaths – 1,754 (2012)

Air pollution – 28,000 (note – this only includes deaths from PM2.5 particulates, excluding NOx and other pollutants – the total death toll is likely at least double this)

Inactivity – 96,000 (estimates vary – I have argued in the past that current estimates are far too low and that the true number of inactivity related deaths is likely to be in the region of 200,000 deaths due to systematic errors with how these estimates are obtained; but let’s stick with peer reviewed numbers and quote Lee et al)

We can see from this data that relatively few people die cycling or walking; many people die because of not walking or cycling (from inactivity) or as a result of excessive use of motor vehicles (from air pollution).  It should be clear that it is not possible to be inactive if walking or cycling make up a reasonable portion of your travel and you wish to have any kind of work or social life.  The vast majority of air pollution is caused by motor vehicles, and this pollution has the greatest effect as high population areas tend to have the highest levels of motor traffic.

Total deaths while walking or cycling: 538

Total deaths due to low levels of walking and cycling: 124,000 (note: likely a low-end estimate)

We can see that there is an urgent need to increase the levels of walking and cycling and reduce motor travel to reduce inactivity and air pollution deaths.  However, I also argue that mode shift itself is likely to reduce road deaths overall in any case.  Why?  Well, very few people die on our roads without a motor vehicle involved.  To me, it seems self-evident that reducing motor traffic’s dominance on the road will reduce the high speeds which result in collisions being fatal, but also reducing the number of motor vehicles reduces the number of opportunities for fatal or serious collisions, all other things being equal.  There is also a large volume of evidence for something called the ‘Safety in Numbers’ effect – more people on bikes provides a protective effect for others on bikes as those in motor vehicles become more used to looking out for them and predicting their behaviour.

What is implicit in the numbers above is that where there is a conflict between safety and encouraging mode shift, mode shift takes precedence because many more people are killed by a lack of cycling and walking – by at least 2 orders of magnitude – than cycling and walking.  

How can we bring about this mode shift?  The evidence is clear that the major barriers to people walking and cycling is a perception of danger, and because they do not feel they have enough time to walk or cycle to their destinations.  I suspect that part of the reason that infrastructure has been ignored for so long in getting people cycling is that if you ask people why they don’t cycle now if they want to, that they will often say “it’s too far” when really they mean that the cycle infrastructure is substandard, slow and inconvenient, which makes it too far.

I do not believe that simply telling people that cycling is statistically safe is likely to result in significant mode shift.   Real changes are needed to the streets to achieve this along the Dutch/Danish/New York/Barcelona/Seville/Munich model which has proven to be successful in mode shift. It should be clear that almost always those things which encourage more cycling are likely to improve safety too – as tackling subjective safety is likely to improve real safety.  However, there are certain situations where there may be conflicts between safety and directness and convenience.

Where might there be conflicts between mode shift and safety? I have seen it suggested that cycle priority crossings over roads are more dangerous than where those cycling give way to motor traffic.  This is an example where in most circumstances, unless there is an extremely large difference in risk, the trade off with speed means that you reduce deaths the most by prioritising cycle crossings because mode shift trumps nominal safety.

There are also implications at junctions.  For example, installing a ‘hold the left turn’ junction may be the gold standard for preventing left-hooks at junctions; but if this pushes the cycle time up for that junction, imposing more delay, the safety benefit may be outweighed by a small decrease in mode share of cycling due to extra wait time.

To summarise:

1. Transport related deaths due to air pollution and inactivity outweigh those caused by collisions by at least 2 orders of magnitude

2. This means that careful consideration needs to be given to any trade-off between those features of a cycle or walking network that improve safety on the road at the cost of slowing speed of progress of those walking or cycling, because this may have implications for the degree of mode-shift – but of course bearing in mind that a feeling of fear is one of – if not the – major deterrent to people walking and cycling more

2 Comments

Filed under Uncategorized

A rational choice

There’s a lot of misunderstanding about why people cycle.  Often, the assumption seems to be that those that cycle do it for noble  reasons – because it’s good for the environment or good for reducing air pollution; other times it seems to be perceived as something that people do because of other, social, benefits – e.g. to fit in with a group of friends or because it’s something you’ve always done as a habit.


Understanding the reasons for people cycling help us to know how we can encourage people to cycle more.  If we think that the reasons are environmental, then we can highlight this fact – but I have to be honest, I think that consideration of the environment rarely figures, apart from as a tie-breaker when two modes of transport are very close, when it comes to making decisions on how we travel.


For me, and I suspect for most others that cycle, it’s just the rational choice.  Let’s take a look at my transport options as a case study:


Drive (this always used to be my primary mode of transport, even once I moved to London in 2007):

Money: £4,500/year for all transport

Time for my current commute (Roehampton – King’s Cross): 60 minutes each way, 120 minutes a day (assuming no major traffic-trauma or parking-related issues).


Public Transport: 

Money: £1,472  zone 1-3 travelcard; plus assume £500 for other train travel – £1,972

Time for my current commute: 70 minutes each way, 140 minutes a day


Bike:

Money: £2,000 (includes all bike expenses plus train travel where bike not practical)

Time for my current commute: 35 minutes each way, 75 minutes each day (I have excluded shower time in the morning as I would shower in the morning in any case – but have included 5 minutes for the extra shower I tend to have at the end of the day).


Walk:

Money: assume a £60 pair of walking shoes every 3 months = £240

Time for my current commute: 180 minutes each way; 360 minutes a day


Given that I’d be walking 6 hours a day, I think I’ll discount walking! (although I did walk it for one day on walk to work week, it wasn’t very practical for a journey of this length)


So far, it looks like the bike just skims it, doesn’t it?  But wait a minute – if I cycle, do I need to go the gym any more?  No.  We know that the best health outcomes come from 300+ minutes exercise a week – so let’s assume I only really need an hour of exercise a day, five days a week.  I don’t need to pay the £40/month gym fees either.


How does it look now then?


Bike (adjusted for no need to go to gym):

Money: £2,000 – £600 gym fees = £1,400

Time for my current commute: 75 minutes – 60 minutes exercise time = 15 minutes


So in a typical year, when I compare against when I used to drive, I’m saving £3,100 a year; and saving nearly 2 hours EVERY DAY.  Even compared to public transport I’m still saving enough to pay for a long weekend away each year and 2 hours a day – compared to a car, I’m saving enough for a 3 week holiday!


Cycling is for me, the only rational choice, and that is why I cycle.  Even if I were deeply unfit – say I could only cycle at half the speed – I would still be saving time; but in addition, if I were that unfit the cycling would be adding years to my life – an average person gains an hour of life for every hour cycling.  Given 2 hours plus exercise a day, I wouldn’t stay unfit very long either – I’d get fitter and faster.


I’d guess that for most people cycling, the same is true – they aren’t trying to save the planet, they just value their time and money!

Leave a comment

Filed under Uncategorized

What’s the real UK death toll from inactivity? Part two – how many?

In part one of this series I looked at why a lack of exercise causes premature deaths; the aim of this second part is to take a look at exactly how many people may be dying from a lack of exercise. My analysis shows that this number is very high, but it also seems that the studies that I found were underestimating the true death toll due to systematically conservative assumptions in approximations used.


The studies:

The HIPI model, based on Lee et al (http://www.sciencedirect.com/science/article/pii/S0140673612610319), predicts a death toll of 36,815 people a year in England, for ages 40-79, but only from coronary heart disease, colorectal cancer, breast cancer and diabetes.   This has a few conservative assumptions from my point of view: I think people start to die of inactivity from childhood (though admittedly in far lower numbers); it ignores many illnesses thought to be caused by inactivity; it uses guideline minimum amounts of exercise (150 minutes) as its baseline for active, and it doesn’t take in the whole of the UK (to allow us to compare to other equivalent statistics).

To correct the last point, we can make an approximation by taking into account the population size of England as compared to the UK, assume that the populations show similar behaviour, and arrive at an estimate of about 44,000 deaths per year in the UK. Of course, this still leaves the other issues – so let’s go back to look at the underlying study – Lee et al.


Lee et al quote an all-cause mortality burden of 16.9% of all deaths in the UK – with a total death toll of about 569,000 per year from the ONS, this yields 96,000 deaths per year. Again, they are assuming that active people are doing guideline amounts of exercise (i.e. over 150 minutes); they also assumed that only people over the age of 40 suffered increased mortality rates. These are two flaws which lead me to expect that this is an underestimate.


Whats the issue with current thinking?

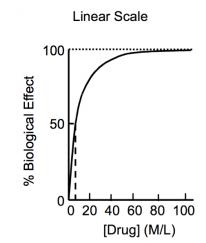
Most biological systems deliver a dose response curve that looks a bit like this:

Dose-response

Basically, initially as we increase dose, you get maximal response up until a point (corresponding to about 20M/L of the drug in the graph above) where the effect of each additional dose decreases. Of course, in the case of exercise, the units of our dose will be measured in calories, minutes of activity or some measure that accounts for volume and intensity of exercise.

The above studies use models for calculating the death toll from inactivity assume that somewhere in the region of 150 minutes of exercise a week (the UK guidelines) deliver almost all of the benefit that exercise can bring. This is based on the dea that 150 minutes is at the ‘plateau’ stage of the above curve – where an increase in dose will be a small, or no, further improvement in health outcomes. I believe that this is not true, and in fact the Lee et al study in the Lancet does acknowledge this as a limitation in their estimates. A large meta-analysis (a review of available evidence) (http://ije.oxfordjournals.org/content/early/2011/09/05/ije.dyr112 ) gives an estimate of a 14% reduction of deaths at 150 minutes of exercise, and 26% – nearly double – at 300 minutes.

In fact we repeatedly find (http://www.indiana.edu/~k562/articles/role/Lee%20PA%20morbidity.pdf, http://www.thelancet.com/journals/lancet/article/PIIS0140-6736(11)60749-6/fulltext ) that in fact, over the range of durations studied, there appears to be an linear relationship between volume of exercise and decreased mortality rates – i.e. a doubling of exercise volume doubles the protective of effect of exercise.

It feels intuitively as if there must come a point where increasing exercise volumes do not keep on reducing death rates per year – but it seems from the studies reviewed that we have not reached that point at 300 minutes, let alone 150!

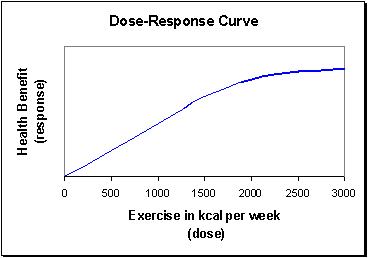
We can draw a dose-response curve for exercise using currently available data, in fact someone has already done this for me using data from one study:


Dose-responseexercise


It seems moderate exercise for various activities yields about 250 calories per 30 minutes; so it looks like we’re reaching the point where the benefits of exercise start slowing at about 2,500 calories exercise per week – or 10 x 30 minutes of exercise a week – 300 minutes (warning – fast and dirty approximation!).  Note that it appears that the benefits are still accruing, albeit more slowly, at 3000 Kcal per week.

Interestingly, there seems to be no lower threshold for exercise effectiveness (so there’s no flat spot at the start of the graph) – basically any amount will start improving your health.


So: how many?

The evidence above seem to show that best available protection from deaths by exercise comes at more than 300 minutes of exercise a week. The studies investigated above are based on 150 minutes – which seem to show about half the level of benefit of 300 minutes.

This means that the benefit to those individuals doing less than 150 minutes can be expected to double – but this isn’t the only effect. There will be a fair chunk of the population that were considered ‘active’ under previous studies but who are doing less than 300 minutes of activity a week, and these will also benefit from doing more exercise. This leads me to suggest that the studies above are underestimating the possible protective effect of exercise by at least a factor of 2.

Applying a factor of 2 to Lee et al gives a death toll from inactivity, UK-wide, of 192,000 deaths per year. Note, this is a very fast and dirty estimate and needs further investigation, but can be expected to be a low-end estimate as I have ignored the benefit to those individuals doing between 150 and 300 minutes of exercise a week for simplicity.  I have ignored the number from the HIPI model, as it is based on the same underlying data, but is clearly ignoring a vast swathe of deaths caused by inactivity from the discrepency with the number generated by Lee et al.

This puts inactivity as a cause of death ahead of smoking (100,000 deaths per year in the UK, from here: http://ash.org.uk/files/documents/ASH_107.pdf); vastly exceeds deaths directly caused by air pollution from combustion emissions (19,000 from here: http://pubs.acs.org/doi/abs/10.1021/es2040416); and absolutely dwarfs deaths from road traffic collisions (1,754 deaths in 2012).


Notes of caution:

These calculations are based on correlation studies – i.e. they look at how much less likely someone who exercises at different amounts is to die than someone who’s inactive; however, as discussed in other blogs correlation does not always imply causation and there may be confounding factors around more affluent people being more likely to exercise.   As affluent people generally live longer, it may be that this is causing the apparent protective effect of exercise. However, there are also other confounders – the types of exercise participated in may expose people to greater risk of dying from other factors – e.g. air pollution from exercising outside. These confounders may cause this study to underestimate the true protective effect of exercise if, say, you were exercising in the country where this air pollution was not present in such high quantities.


Conclusions:

  1. It seems highly likely that any amount of exercise will improve your chance of living a long life – and the more exercise you do, the greater the benefit, until at least 300 minutes of moderate-to-intense activity per week
  2. Guideline amounts of activity are below the optimum amounts for reducing avoidable deaths according to best available data
  3. Available studies seem to be underestimating death rates from inactivity by a large amount, possibly a factor of greater than 2
  4. The reason for these underestimates is an assumption that guideline amounts of activity deliver all possible health benefits from exercise
  5. Applying a correction factor to Lee et al predicts a death toll from inactivity of 192,000 deaths per year – this is likely to still be a conservative estimate, and most likely puts inactivity as the leading cause of avoidable death in the UK by some considerable margin
  6. More research is needed in the field to fully quantify the likely death toll, the economic cost to the state and therefore how much needs to be invested in preventing inactivity through clever urban design and sports and physical activity interventions


3 Comments

Filed under Uncategorized

What’s the real UK death toll from inactivity? Part one – How?

What’s it got to do with movement?

This  post is the first in a two-part series aimed at looking at the true cost of inactivity in the UK in number of lives lost.  Why, this being a transport based blog?  Well, I believe that there is strong evidence that the built environment has a direct effect on peoples health.  We know that exercise is well correlated with lower mortality rates (e.g. meta-analysis (review of research done) here).  In fact, we see that the least fit 25% have mortality rates have four times that of the most fit 25%.  We see this pattern over and over again.  We also know that the number one cause of people not exercising is that people feel that they do not have time to exercise.  The answer, to me, seems to be that we need to help people fit more exercise into their day in time where they would otherwise be sedentary.  This could include more movement at work for some; but with people spending an average of 1 hour every day travelling, I argue that commute/travel time is the obvious candidate for fitting in more exercise.  Often, journeys could be moved at least partly to active travel modes with either a trivial increase in travel time, or often, a reduction in travel times once the quickest route has been worked out, some fitness has been gained and most appropriate equipment sourced.  There is strong evidence from Denmark that cycling to work reduces mortality (your chance of dying in any given year) by 28% once other factors (diet, economic group, other physical activity) are adjusted for  (from this study here).

How does exercise save lives?

Well, we know it prevents heart disease, reduces levels of certain types of cancer; this is a matter of scientific record.  But I think it goes further than that.  I would suggest that being fit, which leads on from exercising, has many other benefits when it comes to staying alive.  Sure, more cycling might increase your chance of being involved in an accident by some small measure over sitting in a train or driving for the same length journey, but it seems reasonable to suggest that your chances of surviving an accident as a fit person are significantly higher – you can control a fall better, and your better developed musculature, tendons and bone structure   will help reduce your chances of death in the event of an accident.  Suicide is the main cause of death amongst 5-34 year olds, and there’s some evidence that physical activity helps fight the depression that leads to it.

What if you still have a fall, a heart attack, or cancer?  Well, my opinion (as distinct from direct scientific research that I can access) is this.  The thing that finally kills you is you no longer being able to pump oxygenated blood round your body.  If you are fit you have more blood, bigger usable lung area, a bigger heart, and better developed blood vessels, then when the crisis comes you can stay alive for longer, giving your body a longer window to sort out the problem, or the magic of modern medicine longer to save you.  Even things as small as doctors being able to take blood samples to find out more about what’s making you ill – because you have bigger veins from exercising more (established long enough that it’s hard to find the studies online, but e.g. here: http://www.ncbi.nlm.nih.gov/pubmed/12640286) – can be expected to be significant (is significant, according to doctors that I’ve spoken to).

Beyond the death toll..

There is also the reduction in quality of life that comes with being less fit: regular exercise cuts the risk of dementia in old age by nearly 2/3; reduces the effects of type 2 diabetes and the chances of being affected by it in the first place by over 50%; there even more immediate short term effects, with reduction in obesity, most obviously, but also brings benefits as wide as increases in intelligence (certainly in children).

The scale of the problem

This all sounds very serious what with all this talk of death, dementia, and diabetes; but I don’t see it that way – I see a massive opportunity to give many people longer, more productive lives with less ill health and disability.  In part two of this blog I will explain why I think that it is possible that as many as A THIRD of all deaths in the UK – nearly 200,000 deaths per year – may be premature deaths which exercise would prevent.  Many of these deaths could be prevented by clever urban design which gives people the opportunity to exercise on a daily basis.  This is higher than previous analysis that I’ve found, but I think I have a strong case that is worth considering.

4 Comments

Filed under Uncategorized

Safety in Numbers – Correlation or Causation?

Correlation does not always equal causation

In a past life, I trained as a Scientist (a Chemist) and I’ve always been drawn to analysis of data. The son of a Pharmaceutical Researcher and a Public Health professional, I was brought up with “correlation =/= causation”. Sometimes, though, you have to say that a correlation is so strong, and seen so repeatedly in so many different circumstances independent of other factors that the link is almost certainly causative. Despite what people may tell you, science is never certain about anything – the scientific method means that something is always open to being disproved – e.g. the speed of light being the ‘fundamental speed limit’ is still open to being challenged by stray Neutrino’s travelling faster.  So it isn’t possible to say anything ‘for certain’, but here’s a great case study for you.

Safety in numbers (S/N)

I blogged about this here, but my argument was a bit weak and incomplete. I intend here to show the full weight of the argument, and why I think that S/N is ‘the real deal’ – by which I mean that, all other things being equal, more cycling will improve the safety per cyclist.

What is ‘Safety in Numbers’?

S/N is the idea that as you increase the numbers of a group of road users on the road (cyclists or pedestrians), that the safety per person using that mode improves – i.e. if you double the number of people cycling, you do not double the number of accidents – the number of accidents either rise very slightly, stay stable, or counter-intuitively, fall. I am most interested here in looking at the case for S/N in cycling as this is the evidence I’m most familiar with, and it’s easier just to use one example to keep the blog concise.

How does it work?

There are a number of possible mechanisms for S/N; it could be that increased numbers mean that other road users are more used to looking out for the more common road users and anticipating their movements; it could be because the infrastructure is built to better cater for the more common road users; finally, it could be that more people cycling, or walking, means less cars and therefore less interactions which could lead to a collision of enough severity to be recorded.

The evidence:

NB – it should be noted that there is a general trend of falling death rates on our roads, as we learn to keep people alive better and cars become more collision friendly.  The data below should be seen in that light.

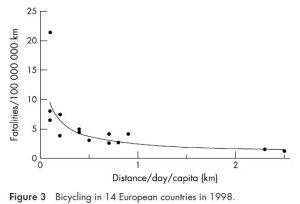
1. Cycling in 14 European Countries, 1998:

Bicyclingin14europeancountries1998

There is a clear relationship here, showing that those countries with the highest levels of cycling have the lowest numbers of fatalaties per 100,000,000 km.

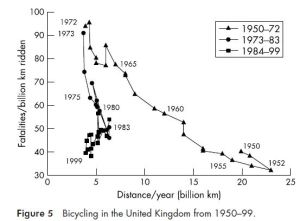
2.  Levels of cycling against fatality rates – UK 1950-99

Cycling in UK 50-99

a)  Between 1950-52, cycling levels rose and fatality rates fell

b) Between 1952-1972 there’s a pretty clear relationship showing that less cycling correlates with higher fatality rates.

c) Between 1973 and 1999 fatality rates fell despite cycling levels remaining roughly constant – I believe this to show a marked improvement in our ability to keep people alive, as a similar effect is seen in driving accidents.

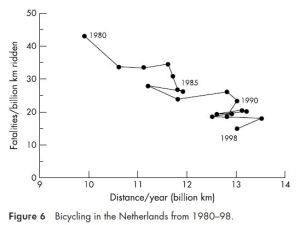
3. Levels of cycling against fatality rates – Netherlands 1980-99

Cycling in NL 1980-98

It’s commonly thought that cycling was always common in the Netherlands.  Certainly, similar levels of cycling to the UK were common until the 60s (ie very high), but they then fell, and have been recovering since the late 70’s, as can be seen above.

This graph shows very clearly that as distance cycled per year increases, safety improves.  However, there is a major confounding factor here – the Dutch changed path in the late 70’s and went all-out to promote cycling.  This led to a program of cycle track building, closing of roads to cars but not cycles etc, building a fit-for-purpose, safe cycling network which will have also had an effect.  So are numbers of cyclists increasing because it’s getting safer to cycle?

Numbers from safety?

It is also commonly argued that it is ‘numbers from safety’ not ‘safety in numbers’; i.e. that more people cycle where conditions are safer to cycle and this accounts for the evidence usually put forward for the S/N effect rather than increasing numbers driving the improvement in safety. It is clearly true that the number one reason that people do not cycle currently in countries such as the UK is a perception of cycling as being dangerous, and the lack of infrastructure to allow people to cycle in safety and comfort. So, is it an increase in numbers cycling that improves safety, or the other way round?

The evidence above cannot differentiate between infrastructure being implemented leading to ‘numbers from safety’ and a true ‘Safety in Numbers’ effect.  What we need is an intervention which will affect cycling numbers in a short period of time without a change in levels of infrastructure.  A perfect example of this is introducing a helmet law and enforcing it – it’s well established that helmet compulsion laws lead to a collapse in numbers cycling.  What happens to safety in the immediate aftermath of these laws being brought in and enforced?

If safety is coming from numbers, independently of infrastructure, we would see that accident rates and deaths per cyclist increase as the number of cyclists decreased.  If this effect was observed over a short time period, where infrastructure cannot be expected to be implemented or taken away, then it is reasonable to assume that it is caused by the change in number of cyclists directly, by whatever mechanism.

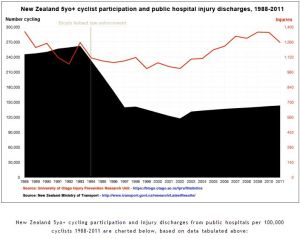
1. NZ Helmet Compulsion Law – Introduced 1994

NZ helmetlawsafety

(Graph from here: http://www.cycle-helmets.com/zealand_helmets.html)

This is a fascinating set of data.  Over the course of 3 years, the number of people cycling halves, but the total accident rate stays roughly stable (meaning an increase in risk per person) – and then starts to increase further.  Safety in numbers in reverse – as the number of cyclists fall, the risk per cyclist rises.

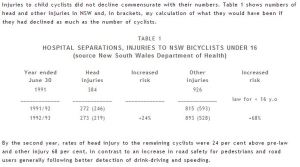
2. Australia Helmet Compulsion Law – 1991

(Data lifted from here: http://www.cycle-helmets.com/helmet_analysis.html)

AushelmetlawSafety

Again, numbers of injuries per cyclist rose as the amount of cycling decreased.  I believe that this is strong evidence that safety does come from numbers of cyclists, as well as infrastructure and other measures.

NB – you’ll note that the data in the two studies above is not in the same units as the graphs at the top.  Both final sets of data measure injuries, not fatalities.  However, I believe that to a good approximation injuries will be proportional to deaths over a short time period – over larger periods of time, as noted above, we are becoming better at keeping people alive; but all of these studies look at periods of time of a decade or less*.

Conclusions:

1.  The ‘Safety in Numbers’ effect exists in cycling and as numbers increase, all other things being equal, safety per cyclist improve as shown repeatedly in different studies.

2. There may well be a ‘numbers from safety’ effect where good quality infrastructure and lower speed limits are in place, but safety in numbers exists independently of these measures.

3. The existence of this effect should not be taken as an excuse not to build infrastructure as this is likely to improve safety further.

4.  Helmet compulsion is a poorly considered idea which reduces levels of cycling with downstream public health effects from less people exercising and increases the risk of remaining cyclists having an accident.


My view of how science works is that it doesn’t matter who is making an argument; an argument should stand or fall on its own merits. So don’t take my word for what’s below – I’m happy to have my ideas challenged. Comment away!


*Fatalities may be slightly reduced by the increased wearing of helmets, but this would be a separate effect from looking into Safety in Numbers

9 Comments

Filed under Uncategorized

Take Away Space From Cars to Reduce Congestion For All

Time and time again in discussions of walking, cycling and public transport infrastructure I hear the argument that ‘we don’t have space’ to allow for these modes because we have to provide for cars – but does this argument stand up to scrutiny?

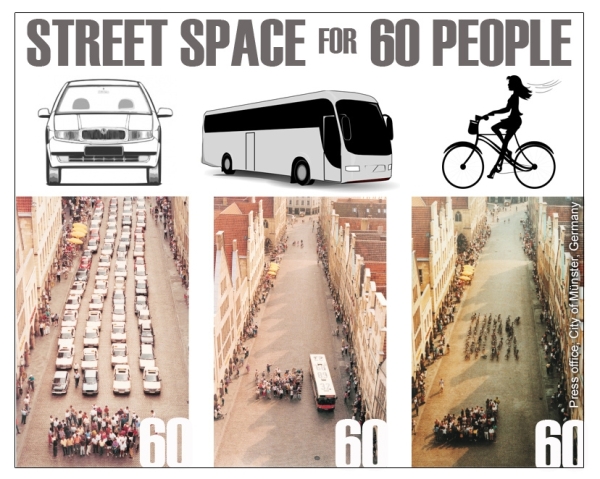
This picture gives a clue:

spacefor60people

This picture isn’t without its issues – for example it assumes one person per car, and full occupancy for the bus.  Typical occupancies for cars are 1.6 overall and 1.2 for commuting journeys.  The time that space is most critical is at peak times, i.e. when the majority of traffic is people commuting. Let’s assume (generously) that we can squeeze the number of cars down by 1/3 by fitting in 1.5 people per car. They’re still taking up a lot more space than 60 bicycles and way more than one bus. Of course, one person per bus would not be a better use of space than one person per car; clearly.

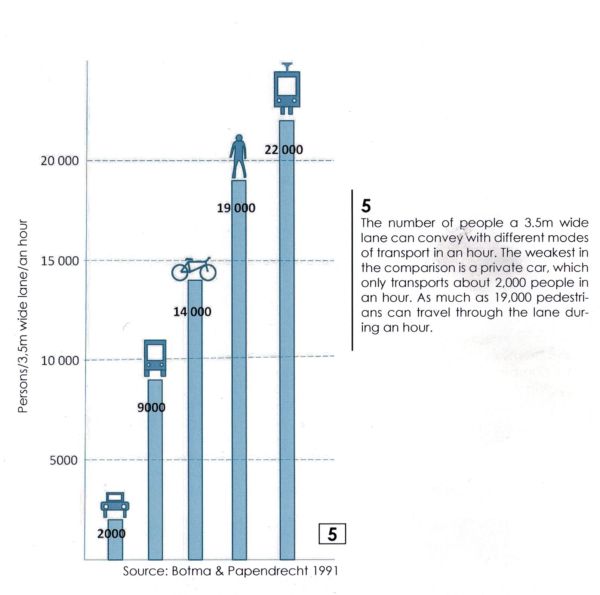
But there are also other factors at play here – space taken up is one factor affecting congestion, but it’s clear that smooth flow of traffic and speed of movement are also important. So we’ll have to dig out some traffic count data to get the full picture (sorry!).

SpaceEfficiencyofDifferentModes

This makes it pretty clear – the photo is, roughly, representative – if you have a limited amount of space to fit a critical number of people through in a limited time, you should prioritise trams and light rail, walking, then cycling, then buses; and your last port of call should be the private motor car (at nearly 10 times less space efficient than walking).

I argue that cycling is the one mode of transport that we generally don’t provide for in any meaningful way in the UK – most people feel it is not possible for them to cycle, because of how hostile roads feel.  It is here that there is the greatest unmet demand.  It’s also incredibly cheap compared to other ways of moving people around and provides paybacks in the region of 40:1; 4:1 just from the health benefits.  It is here that we should focus our efforts in the short term.

Not only will investing in cycling, and to a lesser extent, walking and public transport mean that more people can move around, but it means that those who have longer journeys to make who can’t possibly walk, cycle or take the bus will benefit too – this is backed up by data from TomTom who ranked the most congested cities – all the top 5 had less than 2% of trips done by bicycle, and data from New York which suggests that even when segregated cycle lanes take away space from cars that they increase traffic speeds.

That’s right, building cycle infrastructure is what’s best for those people who will never travel by any other way than driving too; as well as what’s best for people who cycle, pedestrians and everyone in the town or city (from less noise, less pollution, less road danger).  Less people driving means faster journeys for drivers, users of public transport, pedestrians and cyclists.  It’s not a zero sum game where we take from one and give to another – everyone wins from cycling, even those that won’t ever cycle.

The argument that says that where we have a limited resource (in this case, space) that we should prioritise use of it for the least efficient use of that resource (cars) is fundamentally flawed.  Let’s end the nonsense of using it to prevent the implementation of decent quality walking and cycling infrastructure and the closing of bus lanes. Let’s allow people to walk, cycle and take public transport for more journeys if they want to, by making it quicker, easier and safer to do so – saving money for individuals and vast amounts for government. Let’s allow those people who need to, to drive on less congested streets.

Yes, that means some short term pain as we take back space from the motor car – there will be increased congestion in the short term in certain places; but in the longer term, behaviour will change as we grow comprehensive networks for walking, cycling and public transport and within the first year or so of this kind of effort, the congestion will decrease, freeing up more road space for more ambitious walking, cycling and public transport projects.

Everyone will end up a winner; why would you not?

2 Comments

Filed under Uncategorized

Motorists are responsible for most cycle-car collisions in London – what can people on bikes do to protect themselves?

This article in the Times – http://www.thetimes.co.uk/tto/public/cyclesafetyarticle3758677.ece –  quotes a study by Westminster Borough Council which shows that 68% of accidents involving bikes and cars are the fault of the driver rather than the biker.  As well as being an eternal geek, I’m also a qualified cycle instructor – so I thought I’d look at the most common types of accident and look at how these can be prevented.  Many of these will be obvious to experienced cyclists – but some types of accident may not.  This type of analysis should show up the type of accident that people are failing to predict (because they otherwise wouldn’t be getting hurt in them) and that you might think that you therefore might not spot.

First note: Cycling is pretty safe.  We’re talking 120 deaths across the whole country per year, and 10 across London  – as compared to 100,000+ from inactivity nationally.  You are much more at risk from sitting on your sofa than you are riding a bike!  However, knowledge is power and knowing more about keeping the type of accidents that cause harm to cyclists will help you protect yourself.

Second note: Reading a blog on the internet isn’t a replacement for cycle training, which will cover many the points discussed below and go into much more depth on a riding style for you.  I thoroughly recommend considering cycle training.

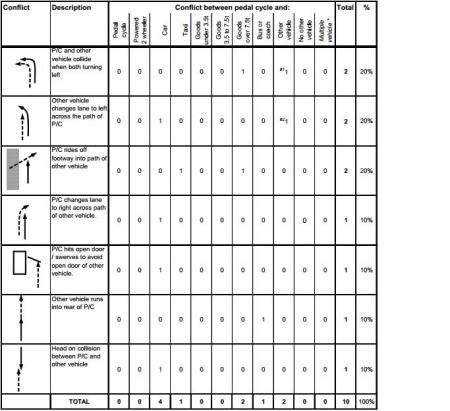
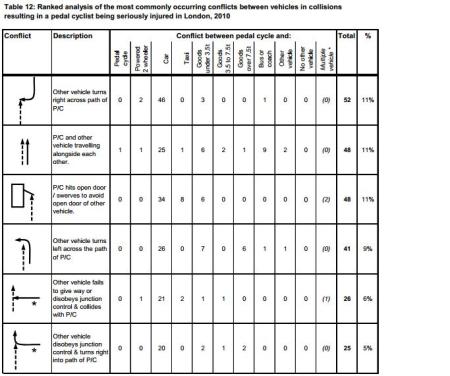
I started by looking out the most common causes of accidents involving bikes and cars, from this report by TfL from 2011: http://www.tfl.gov.uk/assets/downloads/pedal-cyclist-collisions-and-casualities-in-greater-london-sep-2011.pdf

Table showing conflicts causing deaths of bike users:

DeathsonLondonsRoadsCyclists

Table showing most common conflicts causing serious injury to bike users:

SeriousInjuriesonLondonsRoadsCyclists

What conclusions can we draw from this information?

1. STAY OUT from the left hand side of HGV’s, skip lorries, cement mixers etc.  These have a habit of turning left over cyclists, and caused 3 deaths in 2011 and 2 serious injuries.  Stay behind these unless there is plenty of room to get past and out of the drivers ‘blind spot’ (basically to where you can see the driver’s eyes).  You might be better overtaking on the right where there is space to do so.  Never pass a lorry that is indicating left on the left hand side!  If you get caught out alongside a HGV then get the bike out of the road and onto the pavement.

2. Look behind you!  It’s critical that you don’t pull out in front of moving traffic – another 3 deaths and 25 serious injuries were caused by bike users either exiting the footway into the path of traffic, or changing lane into a moving stream of traffic. Check behind you before you set off, and before moving out to pass parked vehicles.

3. Avoid the door zone (the bit where car doors might open into).  Door zone accidents caused 1 death and 48 serious injuries in 2011.  Anticipate well ahead and  move out away from parked cars – leaving a car doors width.  Motorists might not expect this – so make sure you’re observing point 2.

4. Anticipate others’ mistakes.  A vast chunk of accidents causing injury and death to those on bikes are caused by drivers making ‘looked but failed to see’ errors.  Moving out before passing junctions (don’t forget point 2!) will allow you to see cars exiting junctions better (and allow them to see you better) as well as giving you more time to react in the case of them not spotting you – covering the brake levers also allows you to brake quicker in case of need.  Of course – covering the brakes is no good if they aren’t working effectively so make sure your bike is in good order!

But what about helmets?

If you think you might fall and hit your head and you don’t mind wearing one, wear one.  I don’t think they’re anywhere near as significant for safety as learning to avoid crashes in the first place.  You may wish to look at www.cyclehelmets.org for more details.

How do I get cycle training?

Generally training is available through your local council – take a look at their website and find the cycling pages – or give them a call!

Cycle trainers may wish to comment below with how potential customers can get in touch, where you train, and whether you can get funding for training.

5 Comments

Filed under Uncategorized

Who you calling stupid? The cycle helmet debate…

It is funny that one of the few areas of life where people feel able to criticise others’ approach to risk and safety is in cycling.  I repeatedly hear people make comments about how I ‘should always wear a cycle helmet’ – this even after I explain that I have looked into the evidence and am making a conscious decision not to wear a cycle helmet for some journeys – e.g. cycling to shops or around town (note – I think the situation is rather different when cycling as a sport – at high speed, in a group etc; for this, I wear a helmet).  So, how dangerous is cycling without a helmet – and if we’re going to criticise others’ for not wearing helmets while cycling, what else do we need to criticise them for?

Let’s compare to some other everyday things and see how dangerous it really is…all figures are from the UK, and while they may be from different years (because that’s what was available) they are representative.

Cycling deaths per year (2012 – total): 120

Cycling deaths that could have been prevented by cycle helmets – DfT figure: 12 – 19*

Walking deaths per year: 420

Deaths from inactivity caused Coronary Heart Disease/Stroke: 57,000 (McPherson, Klim, 2002)

Deaths from inactivity caused Cancer: 28,000 (McPherson, Klim, 2002)

Deaths due to smoking : 114,000 (NHS figure)

*Note this figure is widely questioned as detailed here, and should be considered an upper end estimate: http://tinyurl.com/oxm2a3r

About 25% of the population smokes, about the same proportion as cycle; the population judged to be ‘inactive’ is actually of the order of 75% of the population.  We can put these numbers into a table showing risk per person carrying out each activity – let’s call it ‘Relative Cycling Helmet Stupidity Index’ – working out the risk of dying per person doing each activity and standardising it against the difference in risk between cycling with a helmet and cycling without.

Cycling helmet stupidity index Adjusted for health benefits
All cycling

3

                     -39
Cycling w/helmet

3

-39

Cycling w/out helmets

4

-38

Difference in risk – w/helmets and w/out;

1

Walking

3

Risk from inactivity

759

Smoking related deaths

3054

So, so far we can see that in order to criticise those who choose to cycle without helmets, we need to criticise smokers 3000 times as much for putting their health at risk as cyclists; and those who are couch potato’s about 750 times more.

Note that the risk per person walking is roughly equivalent to the risk per person cycling (I assumed 100% of the population walks).

However, this is before we adjust for the health benefits of cycling.  I added the inactivity figures to show that, as has been found repeatedly by medical studies, it is many times safer to ride a bike than not – here are a few example medical studies: “Benefits outweigh dangers 13:1” (Woodcock et al, 2009); “Life years saved outweigh those lost by 20:1” (Hillman, 1992), as well as this one which states a 77:1 benefit: risk ratio (but was carried out in Spain, not in the UK) http://www.bmj.com/content/343/bmj.d4521.

I used the most conservative estimate of the relative benefits to adjust for health benefits of cycling, which is the third column.  The negative number in this column means that you are many times less likely to die if you cycle than not – even if not wearing a helmet.  This is even when we use the most conservative number for the benefits; so the likely benefits are many times this number.

So in fact, you are 38 times more likely to live longer because you’re cycling, than to die because you’re not wearing a helmet.  To be clear, on average, you are 38 times more stupid not to ride a bike, than you are to ride a bike without a helmet.  That’s using the most conservative numbers available – the likely benefit:risk ratio is many times higher.

I believe in free choice and wouldn’t criticise anyone else for the choices they make – smoking or being inactive.  I believe that people are best placed to make their own decisions.  However, if you are to criticise others for not wearing a helmet I think that you’re missing the point.  Especially if you don’t ride a bike yourself – who you calling stupid?

2 Comments

Filed under Uncategorized